Prometheus
简介
Prometheus受启发于Google的Brogmon监控系统(相似的Kubernetes是从Google的Brog系统演变而来),从2012年开始由前Google工程师在Soundcloud以开源软件的形式进行研发,并且于2015年早期对外发布早期版本。2016年5月继Kubernetes之后成为第二个正式加入CNCF基金会的项目,同年6月正式发布1.0版本。2017年底发布了基于全新存储层的2.0版本,能更好地与容器平台、云平台配合。
优势
- 多维数据模型: 使用metric名和键值对来区分的时间序列和数据.
- 灵活强大的查询语言支持
- 单节点部署,不依赖于分布式存储
- 数据采集器基于HTTP协议,使用PULL模式获取数据.
- 扫描目标与告警管理支持静态配置与动态服务发现
- 可使用PushGateway推送时间序列数据至Prometheus Server
- 内置Dashboard用于基本功能查看和管理.
组件及生态
Prometheus Server
Prometheus Server是Prometheus组件中的核心部分,负责实现对监控数据的获取,存储以及查询。 Prometheus Server可以通过静态配置管理监控目标,也可以配合使用Service Discovery的方式动态管理监控目标,并从这些监控目标中获取数据。其次Prometheus Server需要对采集到的监控数据进行存储,Prometheus Server本身就是一个时序数据库,将采集到的监控数据按照时间序列的方式存储在本地磁盘当中。最后Prometheus Server对外提供了自定义的PromQL语言,实现对数据的查询以及分析。
Exporter
Exporter将监控数据采集的端点通过HTTP服务的形式暴露给Prometheus Server,Prometheus Server通过访问该Exporter提供的Endpoint端点,即可获取到需要采集的监控数据。
AlertManager
在Prometheus Server中支持基于PromQL创建告警规则,如果满足PromQL定义的规则,则会产生一条告警,而告警的后续处理流程则由AlertManager进行管理。在AlertManager中我们可以与邮件,Slack等等内置的通知方式进行集成,也可以通过Webhook自定义告警处理方式。AlertManager即Prometheus体系中的告警处理中心。
PushGateway
短期存储指标数据,用于临时性的任务,各个目标主机可以上报数据到Pushgateway,然后Prometheus Server统一从Pushgateway上拉去数据。
Prometheus默认是通过exporter主动获取数据(默认采取pull拉取数据),Pushgateway则是通过被动方式推送数据到Prometheus Server,用户可以写自定义的监控脚本把需要监控的数据发送给Pushgateway,然后pushgateway再把数据发送给Prometheus Server。
架构
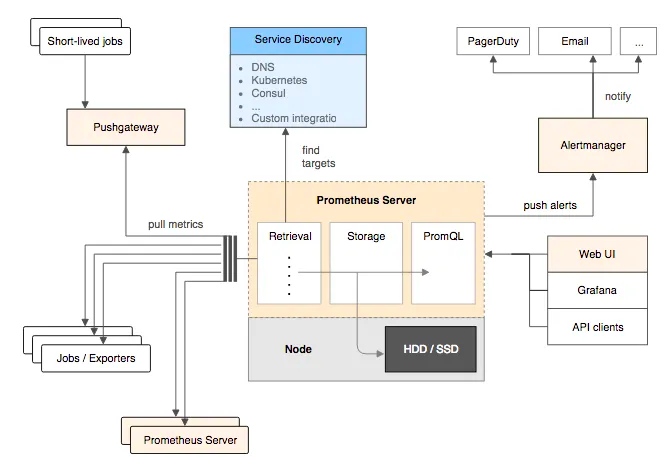
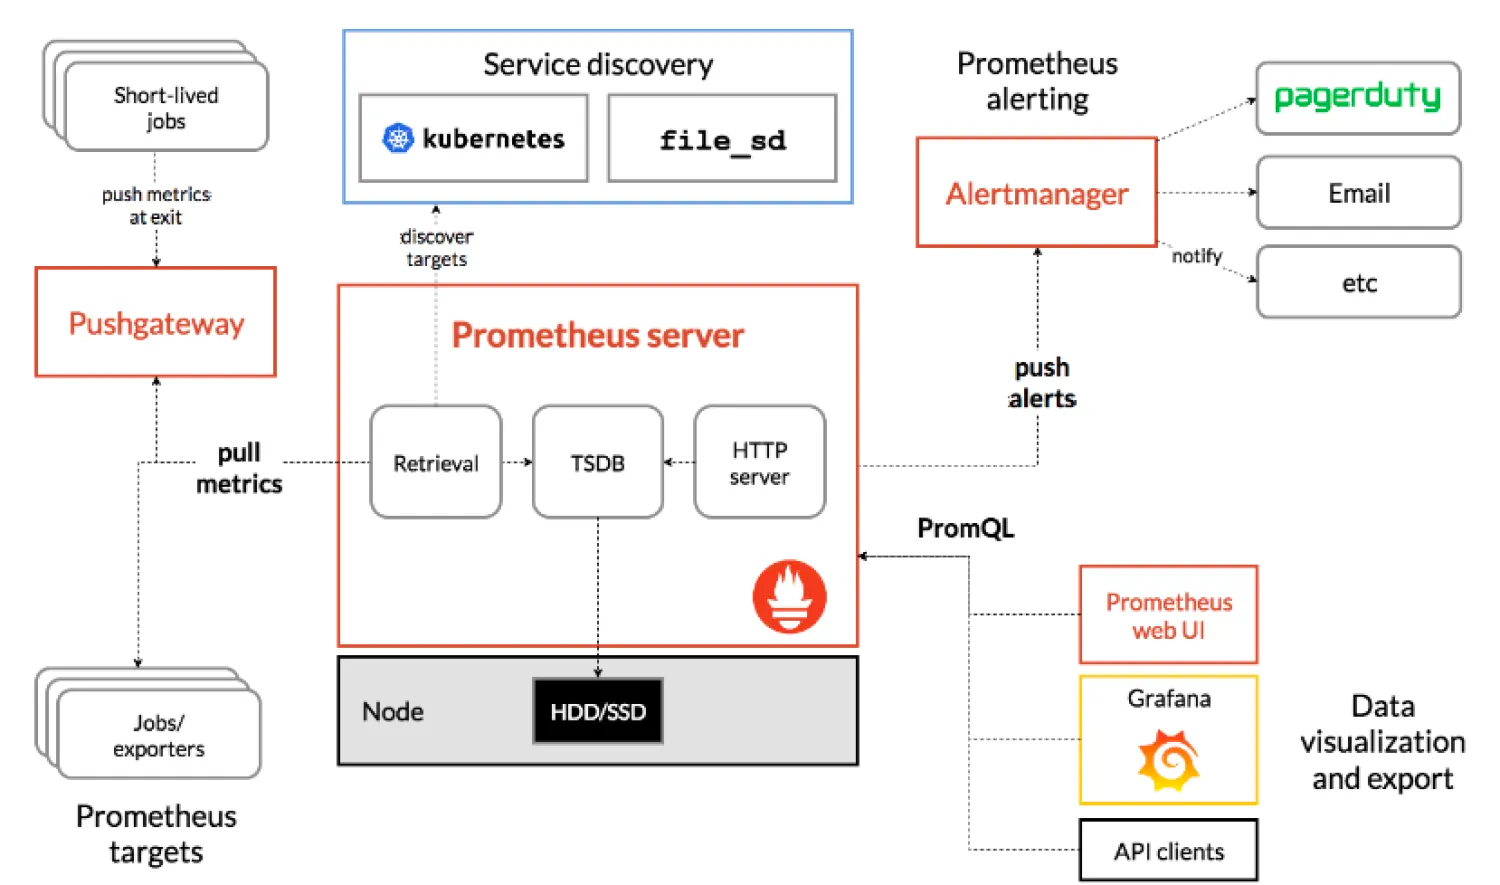 Prometheus的基本原理是通过HTTP协议周期性抓取被监控组件的状态,任意组件只要提供对应的HTTP接口就可以接入监控。不需要任何SDK或者其他的集成过程。这样做非常适合做虚拟化环境监控系统,比如VM、Docker、Kubernetes等。输出被监控组件信息的HTTP接口被叫做exporter 。目前互联网公司常用的组件大部分都有exporter可以直接使用,比如Varnish、Haproxy、Nginx、MySQL、Linux系统信息(包括磁盘、内存、CPU、网络等等).
服务过程
Prometheus服务过程大概是这样:
- Prometheus Daemon负责定时去目标上抓取metrics(指标)数据,每个抓取目标需要暴露一个http服务的接口给它定时抓取。Prometheus支持通过配置文件、文本文件、Zookeeper、Consul、DNS SRV Lookup等方式指定抓取目标。Prometheus采用PULL的方式进行监控,即服务器可以直接通过目标PULL数据或者间接地通过中间网关来Push数据。
- Prometheus在本地存储抓取的所有数据,并通过一定规则进行清理和整理数据,并把得到的结果存储到新的时间序列中。
- Prometheus通过PromQL和其他API可视化地展示收集的数据。Prometheus支持很多方式的图表可视化,例如Grafana、自带的Promdash以及自身提供的模版引擎等等。Prometheus还提供HTTP API的查询方式,自定义所需要的输出。
- PushGateway支持Client主动推送metrics到PushGateway,而Prometheus只是定时去Gateway上抓取数据。
- Alertmanager是独立于Prometheus的一个组件,可以支持Prometheus的查询语句,提供十分灵活的报警方式。
部署
Docker-Compsose
Prometheus Server
目录结构
[root@jsdesign01 prometheus]# mkdir -p /opt/apps/monitoring/prometheus/{data,rules}
[root@jsdesign01 prometheus]# chmod 777 -R /opt/apps/monitoring/prometheus/{data,rules}
[root@jsdesign01 prometheus]# pwd
/opt/apps/monitoring/prometheus
[root@jsdesign01 prometheus]# tree
.
├── data
├── docker-compose.yaml
├── prometheus.yml
└── rules
    └── first_rules.yml
yaml
version: "3"
services:
  prometheus:
    container_name: prometheus
    image: registry.js.design/prometheus/prometheus:v2.32.1
    ports:
      - 9090:9090
    volumes:
      - /opt/apps/monitoring/prometheus/prometheus.yml:/etc/prometheus/prometheus.yml
      - /opt/apps/monitoring/prometheus/data:/prometheus
      - /opt/apps/monitoring/prometheus/rules/:/etc/prometheus/rules/
      - /etc/localtime:/etc/localtime:ro
    restart: always
    command:
      - '--config.file=/etc/prometheus/prometheus.yml'
      - '--web.enable-admin-api'
      - '--web.enable-lifecycle'
      - '--storage.tsdb.retention=15d'
      - '--storage.tsdb.path=/prometheus'
    networks:
      - monitor

networks:
  monitor:
    driver: bridge
参数
--storage.tsdb.path:数据存储位置,默认是data目录。--storage.tsdb.retention.time:保留时间,默认是15天,过15天之后,就删除。该配置会覆盖--storage.tsdb.retention的值。--storage.tsdb.retention.size:要保留的块的最大字节数。最早的数据会首先被删除。默认为0或禁用。 磁盘的最小尺寸取决于:wal目录(wal和checkpoint)和chunks_head目录(m-mapped head chunks)的峰值空间(每2小时会达到一次峰值,然后从内存中初始化到本地存储)。--storage.tsdb.wal-compression:开启预写日志的压缩。--web.enable-lifecycle:热加载配置。'curl -X POST http://url:9090/-/reload'
服务配置
global:
  scrape_interval: 5s
  evaluation_interval: 5s
  # 全局标签组
  # 通过本实例采集的数据都会叠加下面的标签
  external_labels:
    account: "huawei-main"
    region: "beijing"

alerting:
  alertmanagers:
  - static_configs:
    - targets:
      - '172.17.84.238:9093'

rule_files:
  - "/etc/prometheus/rules/first_rules.yml"

scrape_configs:
  - job_name: "prometheus"
    static_configs:
      - targets: ["localhost:9090"]
      - targets: ["172.17.84.238:9100"]
规则配置
groups:
# --- Node
- name: NodeStatus   # 报警规则组名称
  rules:
  - alert: Exporter Componen is Down
    expr: up == 0
    for: 2m  #持续时间,表示持续30秒获取不到信息,则触发报警
    labels:
      severity: serious  # 自定义标签 严重的
    annotations:
      summary: "节点: {{ $labels.instance }} Exporter 程序" # 自定义摘要
      description: "节点: {{ $labels.instance }} Exporter程序异常 请及时处理!." # 自定义具体描述
Node Exporter
目录结构
[root@jsdesign01 monitoring]# mkdir -p /opt/apps/monitoring/exporter
[root@jsdesign01 exporter]# tree
.
└── docker-compose.yaml

0 directories, 1 file
yaml
version: '3'
services:
  node-exporter:
    container_name: "node-exporter"
    image: registry.js.design/prometheus/node-exporter:v1.0.1
    restart: "always"
    ports:
      - 9100:9100
    volumes:
      - "/proc:/host/proc:ro"
      - "/sys:/host/sys:ro"
      - "/:/rootfs:ro"
      - /etc/localtime:/etc/localtime
Kubernetes
安全认证
用于通过k8s自动发现来监控pod、node等相关指标。
apiVersion: v1
kind: ServiceAccount
metadata:
  namespace: monitor
  name: prometheus
---
apiVersion: rbac.authorization.k8s.io/v1
kind: ClusterRoleBinding
metadata:
  name: prometheus
roleRef:
  apiGroup: rbac.authorization.k8s.io
  kind: ClusterRole
  name: cluster-admin
subjects:
  - kind: ServiceAccount
    namespace: monitor
    name: prometheus
---
apiVersion: v1
kind: Secret
metadata:
  name: prometheus
  namespace: monitor
  annotations:
    kubernetes.io/service-account.name: "prometheus"
type: kubernetes.io/service-account-token
服务配置
apiVersion: v1
kind: "Service"
metadata:
  name: prometheus
  namespace: monitor
  labels:
    name: prometheus
spec:
  ports:
  - name: prometheus
    protocol: TCP
    nodePort: 30909
    port: 9090
    targetPort: 9090
  selector:
    app: prometheus
  type: NodePort
---
apiVersion: apps/v1
kind: Deployment
metadata:
  labels:
    name: prometheus
  name: prometheus
  namespace: monitor
spec:
  replicas: 1
  selector:
    matchLabels:
      app: prometheus
  template:
    metadata:
      labels:
        app: prometheus

    spec:
      serviceAccountName: prometheus
      serviceAccount: prometheus

      tolerations:
      - key: "proxy"
        operator: "Equal"
        value: "true"
        effect: "NoSchedule"

      nodeSelector:
        dedicated: monitor

      containers:
      - name: prometheus
        image: bitnami/prometheus:2.46.0
        securityContext:
          runAsUser: 0
        args:
        - "--web.enable-admin-api"
        - "--web.enable-lifecycle"
        - "--config.file=/etc/prometheus/prometheus.yml"
        - "--web.enable-remote-write-receiver"
        - "--storage.tsdb.retention=14d"

        ports:
        - containerPort: 9090
          protocol: TCP
        volumeMounts:
        - mountPath: "/etc/prometheus"
          name: prometheus-config
        - mountPath: "/prometheus"
          name: data

      volumes:
      - name: data
        hostPath:
          path: /data/prometheus
          type: DirectoryOrCreate

      - name: prometheus-config
        configMap:
          name: prometheus-config
端点配置
apiVersion: v1
kind: ConfigMap
metadata:
  name: prometheus-config
  namespace: monitor
data:
  prometheus.yml: |-
    scrape_configs:

    - job_name: 'kubernetes-kubelets'
      scheme: https
      tls_config:
        insecure_skip_verify: true
      bearer_token_file: /var/run/secrets/kubernetes.io/serviceaccount/token
      kubernetes_sd_configs:
        - role: node
      relabel_configs:
        - action: labelmap
          regex: __meta_kubernetes_node_label_(.+)
        - target_label: __address__
          replacement: kubernetes.default.svc:443
        - source_labels: [__meta_kubernetes_node_name]
          regex: (.+)
          target_label: __metrics_path__
          replacement: /api/v1/nodes/${1}/proxy/metrics
远端存储
VictoraMetircs
将以下行添加到 Prometheus 配置文件(通常位于/etc/prometheus/prometheus.yml)中,以便将数据发送到 VictoriaMetrics:
建议将 Prometheus 升级到v2.12.0或更高版本,因为以前的版本可能存在remote_write
remote_write:
- url: http://<victoriametrics-addr>:8428/api/v1/write
Prometheus 将传入数据写入本地存储,并并行将其复制到远程存储。这意味着--storage.tsdb.retention.time即使远程存储不可用,数据在本地存储中仍然可用。
场景1, HA多个配置不同的Prometheus实例
如果您计划从多个 Prometheus 实例向 VictoriaMetrics 发送数据,请将以下行添加到Prometheus config
global部分: 这是必须的,因为要区分不同实例的数据。
global:
  external_labels:
datacenter: dc-123datacenter=dc-123这指示 Prometheus在将每个样本发送到远程存储之前为其添加标签。标签名称可以是任意的 -datacenter这只是一个例子。标签值在 Prometheus 实例中必须是唯一的,因此可以通过该标签对时间序列进行过滤和分组。
场景2, HA多个配置相同的Prometheus实例
如果HA对中多个配置相同的Prometheus实例将数据写入同一个VictoriaMetrics实例,则重复数据删除可减少磁盘空间使用量。这些Prometheus实例的配置中必须具有相同的external_labels部分,因此它们将数据写入相同的时间序列。
VM存储开启数据去重
默认不去重
多个实例推送相同的数据时,配置vmstorage的-dedup.minScrapeInterval=scrape_interval,这样可以防止VM存储相同的数据;
建议的值-dedup.ninscrapeInterval必须等于scrape_intervalPrometheus配置中的配置。建议scrape_interval在所有抓取目标中都使用一个值,保证一个间隔仅存储一个sample。
高负载优化
对于高负载的 Prometheus 实例(每秒 200k+ 样本),可以应用以下调整:
remote_write:
  - url: http://<victoriametrics-addr>:8428/api/v1/write
    queue_config:
      max_samples_per_send: 10000
      capacity: 20000
      max_shards: 30
参数
max_samples_per_send:每次发送的最大样本数。这里设置为 10000,表示 Prometheus 每次最多发送 10000 个样本到远程存储。capacity:队列的最大容量,表示在内存中保存的样本数量。这里设置为 20000,表示 Prometheus 在内存中最多可以缓存 20000 个样本。max_shards:最大并发 shard(分片)数量。这里设置为 30,表示 Prometheus 在发送数据到远程存储时,最多可以使用 30 个并发 shard。这有助于提高数据发送的吞吐量。
使用远程写入会使 Prometheus 的内存使用量增加高达约 25%。如果您遇到 Prometheus 内存消耗过高的问题,请尝试降低max_samples_per_send和capacityparams。请记住,这两个参数是紧密相连的。在此处阅读有关调整 Prometheus 远程写入的更多信息。